Calcul du Gradient d'une image avec Python
Méthode : Gradient de Sobel
Le gradient de Sobel est défini par un noyau de 3 lignes et 3 colonnes.
Le gradient de Sobel selon x est

Le gradient de Sobel selon y est

Dans scilab ce gradient est disponible directement selon x et y, Sobel(img, CV_16S, 1, 0, 3); pour la direction x et Sobel(img, CV_16S, 0, 1, 3); pour la direction y. CV_16S indique que le résultat sera un entier signé compris entre -32768 et 32767.
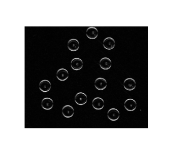
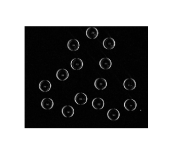
Le code Scilab pour afficher les gradients selon x et y est le suivant :
1
import numpy as np
2
import cv2 as cv
3
from matplotlib import pyplot as plt
4
img = cv.imread('c:/temp/OCV_Haribo.png',0)
5
sobelx = cv.Sobel(img,cv.CV_64F,1,0,ksize=5)
6
sobely = cv.Sobel(img,cv.CV_64F,0,1,ksize=5)
7
8
abs_grad_x = cv.convertScaleAbs(sobelx)
9
abs_grad_y = cv.convertScaleAbs(sobely)
10
modgrad = cv.addWeighted(abs_grad_x, 0.5, abs_grad_y, 0.5, 0)
11
12
13
plt.subplot(2,2,1),plt.imshow(img,cmap = 'gray')
14
plt.title('Original'), plt.xticks([]), plt.yticks([])
15
plt.subplot(2,2,2),plt.imshow(modgrad,cmap = 'gray')
16
plt.title('Module gradient'), plt.xticks([]), plt.yticks([])
17
plt.subplot(2,2,3),plt.imshow(sobelx,cmap = 'gray')
18
plt.title('Sobel X'), plt.xticks([]), plt.yticks([])
19
plt.subplot(2,2,4),plt.imshow(sobely,cmap = 'gray')
20
plt.title('Sobel Y'), plt.xticks([]), plt.yticks([])
21
plt.show()
 | Gradient selon y |
Gradient selon x |  |
Complément : Amélioration du résultat en lissant
L'image est lissée par un filtre gaussien avant de calculer le gradient.
1
import numpy as np
2
import cv2 as cv
3
from matplotlib import pyplot as plt
4
img = cv.imread('c:/temp/OCV_Haribo.png',0)
5
img= cv.GaussianBlur(img, (3, 3), 0)
6
sobelx = cv.Sobel(img,cv.CV_64F,1,0,ksize=5)
7
sobely = cv.Sobel(img,cv.CV_64F,0,1,ksize=5)
8
9
abs_grad_x = cv.convertScaleAbs(sobelx)
10
abs_grad_y = cv.convertScaleAbs(sobely)
11
modgrad = cv.addWeighted(abs_grad_x, 0.5, abs_grad_y, 0.5, 0)
12
13
14
plt.subplot(2,2,1),plt.imshow(img,cmap = 'gray')
15
plt.title('Original'), plt.xticks([]), plt.yticks([])
16
plt.subplot(2,2,2),plt.imshow(modgrad,cmap = 'gray')
17
plt.title('Module gradient'), plt.xticks([]), plt.yticks([])
18
plt.subplot(2,2,3),plt.imshow(sobelx,cmap = 'gray')
19
plt.title('Sobel X'), plt.xticks([]), plt.yticks([])
20
plt.subplot(2,2,4),plt.imshow(sobely,cmap = 'gray')
21
plt.title('Sobel Y'), plt.xticks([]), plt.yticks([])
22
plt.show()
Complément : Le gradient est un vecteur
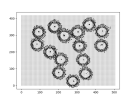
On peut visualiser le vecteur gradient. Le module du gradient indique le contraste (changement d'intensité) et l'angle la direction de cehangement.
1
import matplotlib.pyplot as plt
2
import numpy as np
3
import cv2 as cv
4
5
img = cv.imread('c:/temp/OCV_Haribo.png',0)
6
img= cv.GaussianBlur(img, (3, 3), 0)
7
sobelx = cv.Sobel(img,cv.CV_64F,1,0,ksize=5)
8
sobely = cv.Sobel(img,cv.CV_64F,0,1,ksize=5)
9
10
pas=3
11
X = np.arange(0, img.shape[1], pas)
12
Y = np.arange(0, img.shape[0], pas)
13
U, V = np.meshgrid(X, Y)
14
gx=np.float32(sobelx)[0:img.shape[0]:pas,0:img.shape[1]:pas]
15
print (gx.shape)
16
print (U.shape)
17
gy=np.float32(sobely)[0:img.shape[0]:pas,0:img.shape[1]:pas]
18
fig, ax = plt.subplots()
19
q = ax.quiver(X, Y,gx , gy, scale=100000)
20
21
22
plt.show()


